
20.9K
Downloads
165
Episodes
Long-time fans, born and raised in the heart of Packer Country, talk about the present, past, and future of the Green Bay Packers and the NFL
Episodes
Wednesday Jan 31, 2018
Wednesday Jan 31, 2018
It’s been a little quiet around Green and Gold Forever lately. While it was disappointing not to have the Packers in the playoffs for the first time in the history of the show, it was nice to take a little break, and it was even kind of fun to experience the playoffs as a more casual observer. But don’t worry, we’ll be back with new stuff soon. The 6th Annual Goldie Awards are coming up and, even if I am beyond tired of the Patriots, I still can’t help but get excited as the Super Bowl approaches. And since this season was in an odd-numbered year, it’s time to write some weird Super Bowl blog about alternative Super Bowl history. After the 2013 season, I imagined what the Super Bowl fields would have looked like if some Conference Championship game results through history were changed. After the 2015 season, I did my best to fix ten bad Super Bowls by removing a team that got blown out with a more worthy team and imagined how those new matchups would have played out. This time we’re not changing Super Bowl matchups. We’re going to Vegas!
The Super Bowl is popular for many reasons. It’s the biggest game in America’s biggest sport. It’s the most-watched television program of the year, thus transforming it into the most ubiquitous cultural event in America each year. But it’s also popular because of all of the gambling options. The Super Bowl and gambling are intertwined. In addition to the hilarious prop bets you can make each year (I would take the over on Peyton Manning being in 2.5 commercials), the Super Bowl spread tends to go down in NFL history. Whenever you hear about the greatest upsets in the game’s history, it’s often referencing the point spread. “The Packers blew Super Bowl XXXII after being 11-point favorites”, “Joe Namath guaranteed a win as an 18-point underdog”. There are two well-known betting lines that are familiar to most fans. One is Point Spread, which indicates who is favored to win and by how many points. While I’m sure gamblers could explain this in far more detail, betters commonly bet on the favored team to cover (the favored team wins by as many or more points than the spread) or to not cover (the favored team wins by fewer points than the spread or loses outright). The other frequently referenced betting line is Over/Under. Oddsmakers set an expected number of total points they think will be scored between both teams. Gamblers can wager whether they think the total will be higher or lower than that number (as a side note, I can’t imagine a more tortuous ‘entertainment’ experience than to watch a sporting event in which I’ve bet the Under. Every time ANYTHING happens, including the clock stopping, your anxiety level would go up). These two lines are not meant to predict what will happen in the game. They are intended to entice an equal number of bets on each side of the line so that Vegas can maximize gains and protect against losses. In order to do that, these lines have to match an average fan's expectations for the game. It provides a good barometer for what sports fans and gamblers EXPECTED would happen in a game. As I was thinking about all this, I wondered: What would Super Bowl history look like if Vegas was always right?
I looked at every Point Spread and Over/Under in Super Bowl history and used them together to see what the scores of each Super Bowl would be if both betting lines were accurate. This makes the false assumption that Point Spread and Over/Under influence one another, but this is just for entertainment purposes only. I tried to match them perfectly, but sometimes an exact match of both the spread and O/U was impossible. The "Extra Points" Column is the number of points I had leftover while making the closes match for each game. For the math nerds out there, this is the formula:
(Absolute Value of (Hypothetical Total Points - Over/Under)) + (Absolute Value of (Hypothetical Point Spread – Vegas Point Spread)
Example: Super Bowl V – the Colts were a 2.5 point favorite, and the teams were expected to combine for 36 total points. The closest you can get to total accuracy is a Colts 19-17 victory. In this formula it would look like this:
(19+17) = 36 - 36(Over/Under) = 0
+ (19-17)= 2 – 2.5 (point spread) = -0.5 -> Absolute Value of -0.5 is 0.5.
0+0.5=0.5 Extra Points
In layman’s terms, 0 means that the hypothetical score matches both the Points Spread and Over/Under perfectly. 0.5 or 1 Extra Points means the hypothetical score is off by a half a point or point from either the Spread, Over/Under, or a combo of both. As I said, some spreads and Over/Under were incompatible, making it mathematically impossible to apply both to a real score at the same time. In those cases, I got as close as I could. That's enough math for now. Let’s take a look at the scores.
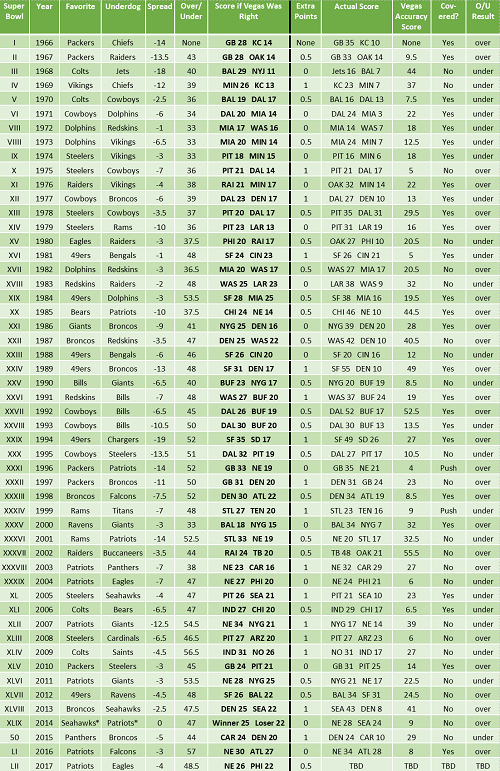
*Super Bowl XLIX was a 'Push" - meaning there was no favorite
To see an enlarged image file of the table in a new tab, click here.
There is a lot to digest there. Here are some highlights:
- The most obvious thing is that Vegas predicted very few blowouts in Super Bowl history outside of the mid-1990s at the height of the NFC’s supremacy over the AFC. In the 1980s, when most Super Bowls were blowouts, they only picked two double-digit spreads– Chicago over New England and San Francisco over Denver. Since Vegas rarely picks a blowout and they picked blowouts for the two most lopsided Super Bowls in history, I’ll give them credit for that.
- One thing I immediately noticed was how strange some of the scores look if you try to make both the point spread and over/under accurate. The most bizarre is Super Bowl III. For the game to match both marks, the Colts would’ve had to beat the Jets 29-11. There has never been a game with that final score in NFL history. Also, 29 and 11 are two of the rarest scores ever. From 1940 through the last season without the 2 point conversion in 1993, only 96 of the 16654 teams to play a game scored 29 points (0.5%). Just 11 teams in that time frame scored 11 points in a game (0.06%). Statistically, the Vegas spread, and O/U called for a nearly impossible outcome.
- I also had to use a score of 25 seven different times to make the spread and O/U work. Had those all happened, those games would’ve accounted for 4% of all final scores of 25 in NFL History.
- The oddsmakers couldn’t peg a San Diego Super Bowl for anything. Buccaneers vs. Raiders was their biggest miss of all time, as the expected Oakland low scoring victory turned into an epic Buccaneers route that saw them cover the O/U all by themselves. Same for Super Bowl XXII when the 3-point favorite Broncos lost by 32. And of course, the 1997 Packers because they were one of the biggest favorites to ever lose – though Vegas was only off by four on the O/U.
- It’s funny how plausible an 18-15 Ravens/Giants Super Bowl seems. Remember, the Ravens went a month without scoring a touchdown that year. Interesting enough, had it happened, that would’ve been the first 18-15 game in NFL history, but there have been 7 in the 17 seasons since then.
Since I didn’t have a lot to say about the hypothetical results, I included an Accuracy Score for the actual Super Bowls played to check how accurate the Oddsmakers were each year. To reiterate, 0 means Vegas hit it perfectly. Anything less than 10 is very good. Anything over 20 is not as good. 30+ is way off. I calculated the average Accuracy Score by decade. I omitted the 1960s due to a small sample size:
| Decade | Vegas Avg Accuracy Score |
| 1970s | 16.35 |
| 1980s | 27.15 |
| 1990s | 17.55 |
| 2000s | 25.45 |
| 2010s | 21.14 |
It kind of makes sense that the 1970s were the most accurate. Scoring was very low throughout the decade, so Vegas set the O/U low, and due to the games being low scoring, the spread never got too out of hand like it did in the 1980s. It’s amazing how badly the 80s performed. It took almost the entire decade for Vegas and wagerers to notice how much more powerful NFC teams were than AFC teams – and even then, they underestimated the scope. Even when they set the 49ers as 13 point favorites over Denver, they failed to conceive San Francisco blowing past the O/U all by themselves and beating the Broncos by 45 in the process. By the 1990s, Vegas and gamblers got savvier. Betters placed their money on NFC teams no matter the spread and pushed some spreads to the widest ever seen. The 91 Redskins and 93 Cowboys blowout wins over the Bills were accurately set. The 49ers were 19-point favorites over the Chargers and STILL covered despite late garbage touchdowns. The last half of the 1990s saw some of the most accurate lines ever. Then things got screwy again in the 2000s, with bad misses in Super Bowls 35 thru 37 and the big miss of the Giants win over the Patriots in 2007. Granted, not many people saw that one coming. Even if their close regular season battle gave you hope the Giants could win, I’m sure no one expected a 17-14 final score.
And just for fun, here are Vegas’ 15 most accurate and 15 least accurate Super Bowl lines by combined Spread and O/U.
15 Games with the Most Accurate Vegas Lines
| Super Bowl | Year | Spread | Favorite | Over/Under | Actual Score | Vegas Accuracy Score |
| XXXI | 1996 | -14 | Packers | 52 | Packers 35 Patriots 21 | 4 |
| X | 1975 | -7 | Steelers | 36 | Steelers 21 Cowboys 17 | 5 |
| XVI | 1981 | -1 | 49ers | 48 | 49ers 26 Bengals 21 | 5 |
| XXXIX | 2004 | -7 | Patriots | 47 | Patriots 24 Eagles 21 | 6 |
| XLIII | 2008 | -6.5 | Steelers | 46.5 | Steelers 27 Cardinals 23 | 6 |
| XLI | 2006 | -6.5 | Colts | 47 | Colts 29 Bears 17 | 6.5 |
| V | 1970 | -2.5 | Colts | 36 | Colts 16 Cowboys 13 | 7.5 |
| LI | 2016 | -3 | Patriots | 57 | Patriots 34 Falcons 28 | 8 |
| XXV | 1990 | -6.5 | Bills | 40 | Giants 20 Bills 19 | 8.5 |
| XXXIII | 1998 | -7.5 | Broncos | 52 | Broncos 34 Falcons 19 | 8.5 |
| XXXIV | 1999 | -7 | Rams | 48 | Rams 23 Titans 16 | 9 |
| XLIX | 2014 | 0 | Push | 47 | Patriots 28 Seahawks 24 | 9 |
| II | 1967 | -13.5 | Packers | 43 | Packers 33 Raiders 14 | 9.5 |
| XXX | 1995 | -13.5 | Cowboys | 51 | Cowboys 27 Steelers 17 | 10.5 |
| XXIII | 1988 | -6 | 49ers | 46 | 49ers 20 Bengals 16 | 12 |
15 Games with the Least Accurate Vegas Lines
| Super Bowl | Year | Spread | Favorite | Over/Under | Actual Score | Vegas Accuracy Score |
| XXXVIII | 2002 | -3.5 | Raiders | 44 | Buccaneers 48 Raiders 21 | 55.5 |
| XXVII | 1992 | -6.5 | Cowboys | 45 | Cowboys 52 Bills 17 | 52.5 |
| XXIV | 1989 | -13 | 49ers | 48 | 49ers 55 Broncos 10 | 49 |
| XX | 1985 | -10 | Bears | 37.5 | Bears 46 Patriots 10 | 44.5 |
| III | 1968 | -18 | Colts | 40 | Jets 16 Colts 7 | 44 |
| XLVIII | 2013 | -2.5 | Broncos | 47.5 | Seahawks 43 Broncos 8 | 41 |
| XXII | 1987 | -3.5 | Broncos | 47 | Redskins 42 Broncos 10 | 40.5 |
| XLII | 2007 | -12.5 | Patriots | 54.5 | Giants 17 Patriots 14 | 39 |
| IV | 1969 | -12 | Vikings | 39 | Chiefs 23 Vikings 7 | 37 |
| XXXVI | 2001 | -14 | Rams | 52.5 | Patriots 20 Rams 17 | 32.5 |
| XVIII | 1983 | -2 | Redskins | 48 | Raiders 38 Redskins 9 | 32 |
| XXXV | 2000 | -3 | Ravens | 33 | Ravens 34 Giants 7 | 32 |
| XIII | 1978 | -3.5 | Steelers | 37 | Steelers 35 Cowboys 31 | 29.5 |
| 50 | 2015 | -5 | Panthers | 44 | Broncos 24 Panthers 10 | 29 |
| XXI | 1986 | -9 | Giants | 41 | Giants 39 Broncos 20 | 28 |
It’s crazy to see how, despite Vegas seeing the ‘85 Bears and ‘89 49ers as solid favorites, each team was so overwhelmingly dominant that it makes those look like huge misses. Also, the oddsmakers were not prepared for the scoring explosion that would come in Super Bowl XIII following the 1978 rules changes. I always wondered why older sportswriters unanimously consider that one of the best Super Bowls ever when it is far less dramatic than many later Super Bowls, as the Steelers led by two scores for much of the 4th quarter. I guess after some of the dull, low-scoring 70s Super Bowls, a game with a lot of points must've stood out as something special. Some other strange quirks - Vegas can rarely figure out what the Broncos are going to do in the Super Bowl, but if the Super Bowl is played in Florida (X, XXXIX, XLIII, XLI, V, XXXIII, XXV, II), they have a pretty good idea.
Finally, what does Vegas say about this year? As of this writing, they have the Patriots installed as a 4 point favorite with an Over/Under of 48.5. So that would translate to a Patriots 26-22 victory. 26 and 22 are both quite rare scores, and there have only been five 26-22 games in NFL history. So it’s safe to say both lines will not be accurate. But a game filled with a bunch of field goals, missed extra points, safeties, 2 point conversions, or whatever mess is needed to get to 26-22 would fit right in with this incredibly strange 2017 NFL Season.
So that's it. I’ll be honest, this idea was far more interesting in my head than it is in writing, but if you’re reading this blog, a chance to look at some fun data might be enough. If not, thanks for reading anyways. Let me know in the comments if anything interesting stands out to you and enjoy the Super Bowl.
Eric Drews
Host
Green and Gold Forever
@GreenGold4Ever
All data for this blog was obtained at Pro-Football-Reference.com. It's the best site on the Internet if you love NFL history.
Comments (0)
To leave or reply to comments, please download free Podbean or
No Comments
To leave or reply to comments,
please download free Podbean App.